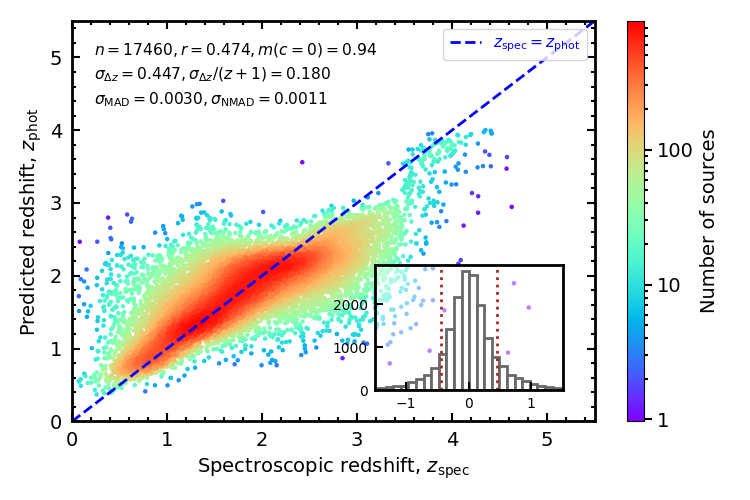
Code to perform machine learning (k-nearest neighbours regression) and plot the predicted versus measured values. This is all contained within kNN.py and supersedes the all of the C code above (thus not requiring me to write my own grey-scale function, etc.).
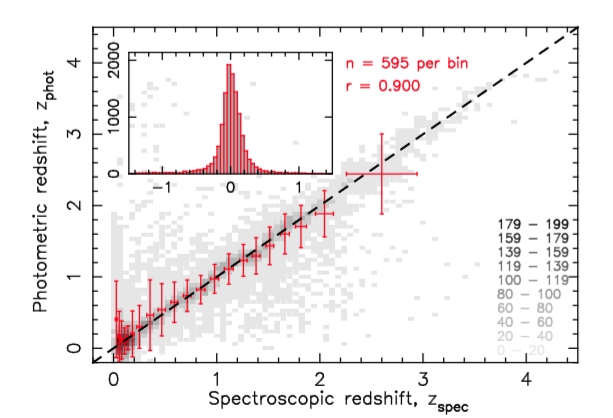
Useful for large datasets, as produces a grey scale and error bars of equally binned data instead of individal points.
Also returns a sub-plot showing the distribution of the difference in the predicted and measured values and gives the mean difference, the standard deviation and outlier fraction.