- Kibana is an open source data visualization dashboard for Elasticsearch. It provides visualization capabilities on top of the content indexed on an Elasticsearch cluster. Users can create bar, line and scatter plots, or pie charts and maps on top of large volumes of data.
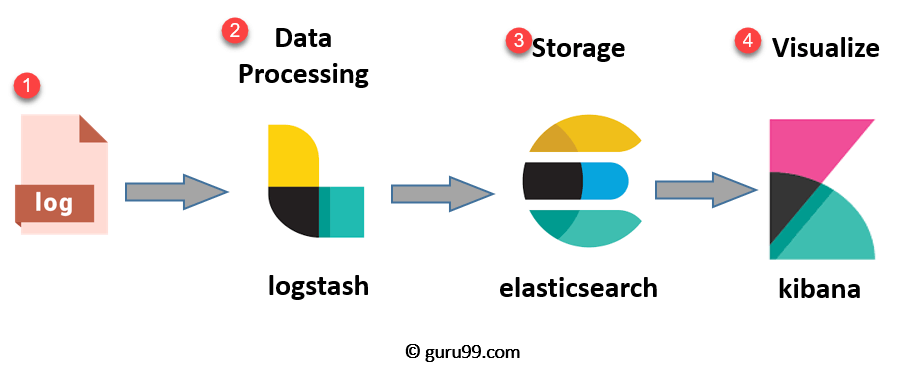
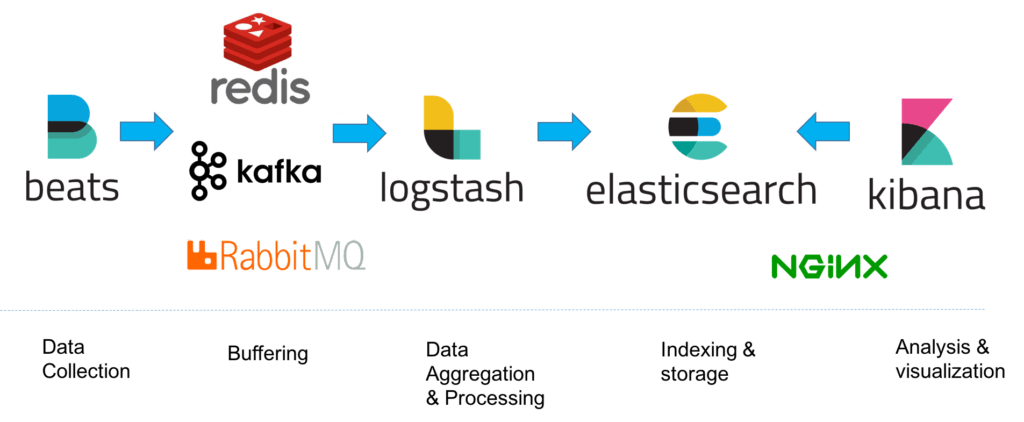
- Kibana is an open-source data visualization and exploration tool used for log and time-series analytics, application monitoring, and operational intelligence use cases. It offers powerful and easy-to-use features such as histograms, line graphs, pie charts, heat maps, and built-in geospatial support. The ELK Stack is a collection of three open-source products — Elasticsearch, Logstash, and Kibana. They are all developed, managed ,and maintained by the company Elastic. E stands for ElasticSearch: used for storing logs. L stands for LogStash : used for both shipping as well as processing and storing logs.
- Kibana uses Elasticsearch which is a full-text, distributed NoSQL database. In other words, it uses documents rather than schema or tables. It's a free, open source tool that allows for real-time searching and analyzing of your data.
- Logstash is the AWS alternative for Elasticsearch. Logstash is a light-weight, open-source, server-side data processing pipeline that allows you to collect data from a variety of sources, transform it on the fly, and send it to your desired destination. It is most often used as a data pipeline for Elasticsearch, an open-source analytics and search engine. Because of its tight integration with Elasticsearch, powerful log processing capabilities, and over 200 pre-built open-source plugins that can help you easily index your data, Logstash is a popular choice for loading data into Elasticsearch.
- used with Kibana as a usecase