build model of computron-to-wallclock relationship #3459
Comments
2000x inaccuracy?
When I fit the data to a line like that, I get 2000x between the fastest and slowest delivery. I'm not confident about the analysis just yet, though. What's good enough?
Under what conditions might we refine the model this way? Slowest validator?
How can I tell which one that is? PostScript: Discussion notes## reduced data set
# chain-wide deliveries
# chain_id, crankNum -> blockHeight, vatID, deliveryNum, kd, compute
# chain_id, vatID, deliveryNum -> blockHeight, kd, compute
# except vatTP?
# per-validator data
# chain_id, crankNum, run (slogfile, kernel-start) -> dur# global crankNum -> vatID, deliveryNum
c500[['crankNum', 'vatID', 'deliveryNum']].set_index()
# ignore un-full blocks?
# histogram of block durations; interval between...
# {"time":1625059432.2093444,"type":"cosmic-swingset-end-block-start","blockHeight":58394,"blockTime":1625059394}
# {"time":1625059432.2096362,"type":"cosmic-swingset-end-block-finish","blockHeight":58394,"blockTime":1625059394}
# "blockTime":1625059381 <- consensus block time is median of block times (?)
# vatID, deliveryNum -> args / syscalls
# watch out for GC esp.
# c.run(runPolicy)
# simple model: kernel says how many computrons
# refinement: computrons, syscalls
# fitness: block distribution... 10s blocks...
# blocks that aren't too big (latency, validator variance risk)
# cpu that isn't idle (throughput)
# an ideal: median block time 10s
# 80 20 %ile
# importing a contract is an outlier# median validator - existing distribution of deliveries / compute -> blocks
# supplement: study wallclock stuff |
Very slow blocks in agorictest-16Note: these slow blocks are all after the official phase 4 end time, 2021-07-02 19:00:00.
agorictest-16 block-to-block time deltas
Phase 4 officially ended 2021-07-02 19:00:00. If we take only blocks before the official end, we get a nicer picture:
Analysis code |


172 slogfiles, ~500MB ea
b64 is bytes / 64, to make the scale comparable to lines
|

|
status: feat: find compute meter mismatches (WIP)It looked like ElectricCoinCo-agorictest16-chain.slog.gz had different compute meter results from about 17 other validators; but it turns out that those results were from agorictest-15 whereas the others were from agorictest-16. The connection from delivery back to blockTime (which distinguishes agorictest-15 from agorictest-16) and run had been lost. I tried to re-attach deliveries to blockHeight and runs based on line numbers, but that seems to be O(n^3) where n (number of lines in the dataset) is in the millions, so not practical. TODO: rebuild delivery data, this time including blockTime and run context. |
|
@ski I just ran across a performance chart you made in #2630 (comment) and it makes me wonder about feeding these data into some tools that pros like yourself use. |
TODO: separate runs by chainI figured out in discussion with @ski that if I do this, I don't have to re-crunch all the delivery data. It was missing
|
|
tonight's approach:
where the summary files should be identical across all validators and the detail files have stuff that varies by validator. |
|
ran out of memory. Processing whole runs at a time in memory doesn't work: some are too big to fit. also, even the summaries were rarely identical because the runs cover different timespans. |
Simple simulation of 10M computrons per blockUsing data from just one run ( This is a histogram of actual computrons per block (excluding
The histogram of block durations looks like:
Breakdown of rate (compute / duration) by method:
p.s. I hope the sim function in my notebook does something reasonable. |


|
@dckc and I spent some analysis time this afternoon. Suppose we crunked our data and magically extracted a stable, consistent ratio from computron to wallclock time that was exactly accurate for a single validator. Now suppose we measure that ratio across a range of validators, both the fast ones and the slow ones. Imagine we get some sort of normal distribution, or maybe normal plus a long tail. Now how should we use this to choose a target computron limit? What are our goals? One goal is to allow results to be returned in a timely fashion (reducing average latency, or reducing 90% latency). But another consequence of long blocks is that it threatens validator liveness. This diagram tries to capture that consequence:
As the set of validators works on executing the transactions in the recently-finalized block, the faster ones will finish that execution before the slower ones. They cannot vote on the next block until they've finished execution. The voting time itself is not significant (and doesn't depend upon the swingset work being done), so their vote on the second block will be delivered some fairly constant amount of time after they finish execution. So these votes will arrive spread out over time. The proposer of block-2 will wait until it sees a 2/3rds majority and then wait for the But, the poor slow validators in the region on the right will still be working on the block-1 execution. If block-2 does not have much work to do, they'll be able to catch up, because of that 5 second delay. But if their excess execution time (beyond the 2/3rds percentile of all validators) is more than 5 seconds, they won't be able to catch up, and their votes for block-2 will be ignored too. If the chain continues to be busy, and never gives these validators a rest, they'll eventually miss so many blocks that they're kicked out of the validator pool. The remaining validator set will be smaller, so the median and 2/3rds percentile time will be slightly smaller, which might put the next-slowest validator at risk of falling behind. Longer blocks (more computrons) will scale the X-axis of that shape, but the 5s timeout does not change. This may cause more validators to fall into the "can't catch up" zone, hastening their departure. So one of our goals in limiting the block duration is to reduce the chances that slower validators will be kicked out. We might want to have the scheduler pay attention to the consensus block time, and it it appears to be elevated, reduce the amount of swingset work we do (reduce the duty cycle) for some number of blocks until it falls back down to the target. |

|
(WIP notes...) Deliveries with little variationIn one slogfile (
Ignoring other than
including a rather dramatic peak:
later:
|


One busy block suggests: 8-10M computrons to 10 secIn agorictest-16, consensus blockTime for blockHeight 78842 was 35sec. A 2:1 ratio of compute time to voting time (i.e. 2/3rds utilization) suggests breaking it into 3 10 second blocks. A plot of cumulative computrons vs. time suggests an 8-10M computron threshold would do it, at least for this block:
based on investigation of Which vats use how much of the time?
|


Visualizing JavaScript messaging in blocksBlock 78851 is a normal 6 second block with 72 deliveries. In
Larger Blocksblock 78840 took 35 seconds; what's going on in there? https://gist.github.com/dckc/e701a84cfa6e22de06966a46bed5cf1a |

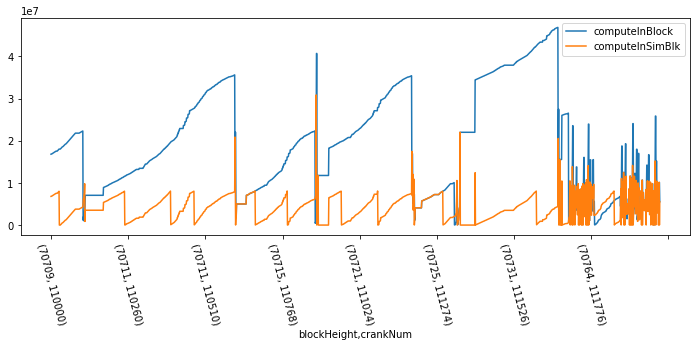
Run Policy SimulationWe take the deliveries and the block in which they arrived. In the simulation, when the compute meter goes over the threshold (8M), we start a new block:
Using time on both axes:
Zooming out to all 300K deliveries from 2021-07-01 10:15 to 2021-07-03 00:27, we get a max compute duration in a block of 13.7 sec simulated vs. 37.4 observed:
The run_policy_simulation notebook has more details. |


Latency: Usually 0 blocks, but max 72!The 8M computron run policy usually delays deliveries by 2 or fewer blocks but in some cases it seems to be as many as 72. I'm looking into what's going on.
|

Strange run of
|
| crankNum | blockHeight | blockTime |
|---|---|---|
| 103200 | 68817 | 2021-07-02 02:33:54 |
| 105500 | 69707 | 2021-07-02 05:07:10 |
| count | median | mean | count | median | mean | |
|---|---|---|---|---|---|---|
| method | ||||||
| fromBridge | 592 | 1.0E+07 | 1.4E+07 | 592 | 0.55812 | 0.8516 |
| inbound | 601 | 1.4E+07 | 2.0E+07 | 601 | 0.20442 | 0.32188 |
| . | compute | duration |
x = pd.read_sql('''
select *
from j_delivery
where crankNum between 103200 and 105500
and file_id = 3288529541296525
''', _db4)

x[x.compute > 1000000].groupby('method')[['compute']].aggregate(['count', 'median', 'mean'])|
In each block, balances for hundreds of accounts are updated in the bank vat:
|
Up to 5000 accounts updated per deliveryIn just the first 100 deliveries in blocks 68817 to 69707:
1000 deliveries: stable trend
|


Early vs. Late Simulation: Computrons go 3.7x faster earlyearly: crankNum 20000 to 70000
late: crankNum >= 250000
rate is compute / duration of a delivery |


Vat Creation: 0.385 sec => charge 300K computrons for
|
| _ | value |
|---|---|
| time to compute in a block | 10.0 |
| time to create vats in a block | 3.0 |
| computron threshold in a block | 8000000.0 |
| time to create a vat (mean observed) | 0.385451 |
| computrons per vat creation (projected) | 308361 |
count    8.000000
mean     0.385451
std      0.003590
min      0.380300
25%      0.382785
50%      0.385533
75%      0.388407
max      0.390025
| blockHeight | blockTime | type | dur | |
|---|---|---|---|---|
| 0 | 64628 | 2021-Jul-01 19:00:00 | create-vat | 0.39003 |
| 1 | 64628 | 2021-Jul-01 19:00:00 | create-vat | 0.3803 |
| 2 | 64628 | 2021-Jul-01 19:00:00 | create-vat | 0.3893 |
| 3 | 64628 | 2021-Jul-01 19:00:00 | create-vat | 0.38811 |
| 4 | 64628 | 2021-Jul-01 19:00:00 | create-vat | 0.38628 |
| 5 | 64628 | 2021-Jul-01 19:00:00 | create-vat | 0.38317 |
| 6 | 64628 | 2021-Jul-01 19:00:00 | create-vat | 0.38479 |
| 7 | 64628 | 2021-Jul-01 19:00:00 | create-vat | 0.38164 |
|
Let's declare victory on this much; we have a working model. We can track work on examining the remaining slogfiles in #3660. |
What is the Problem Being Solved?
To support #3460 (in particular to build the
runPolicyobject it uses), we want to build a model that can look at the metering results for a given delivery, and return an estimate of the amount of wallclock time that would have taken on our validators.We want to build that model from the slogfile corpus we collected during the most recent testnet phase (the "stress test" phase 4). This contains 564GB of data from 117 participants, spread across 172 slogfiles, with varying degrees of overlap. Some validators will be faster or slower than others. For each delivery in the corpus, we want to get statistics on the range of wallclock times taken by these validators. The model should probably return the time taken by the slowest validator which still managed to keep up with the load we applied.
I'm hoping that we can find a roughly linear fit between our metering values (computrons consumed) and the wallclock time of each delivery:
a + bxwherexis the computron count anda/bare the deduced constants. We also know the number of syscalls made during each crank, so we might improve the linear regression witha + bx + cywhereyis the number of syscalls. Finally, many of these deliveries use a variable number of arguments (e.g. the number of virtual purses whose balances were updated by the cosmos-sdk "VBank" module). So the model might get even better if we sum some function of the delivery arguments and feed that into the model.The over-engineered approach to this would involve some form of machine-learning tool that gets the complete set of deliveries and syscalls (including arguments) as training data, and emits a compact function which gets a single delivery-plus-syscalls. The practical approach will be to compute a linear regression over
x. Once we've got a model, we'll want to feed it into the simulator described in #3460 to see how badly it manages to limit blocks to thePblock time target. If it's anywhere close, we should stop there and not try to improve it with more data or more sophisticated analysis.For the next testnet phase, we want:
runPolicyobject, based upon what we learn from this model, which tries to finish blocks when their estimated/predicted wallclock time reaches PIt's ok if the result is not exact: some variation of runtime is entirely acceptable, and we'll be tuning this model (and our choice of P) over time. We should expect that both P and the constants that define the
runPolicyfunction will be changed by governance votes over the life of the chain.tasks:
updatedtrendvat-creationtake?The text was updated successfully, but these errors were encountered: