Skip to content
New issue

Have a question about this project? Sign up for a free GitHub account to open an issue and contact its maintainers and the community.

By clicking “Sign up for GitHub”, you agree to our terms of service and privacy statement. We’ll occasionally send you account related emails.

Already on GitHub? Sign in to your account

Add a "top functions" call tree view #15

Open
mstange opened this issue Oct 25, 2016 · 23 comments
Open

Add a "top functions" call tree view #15

mstange opened this issue Oct 25, 2016 · 23 comments
Labels
call tree Related to the call tree panel feature Work that is user facing, and typically should be planned through https://airtable.com/shrRydo6UXheb quantum flow Issues important to the Quantum Flow team

Comments

@mstange
Copy link
Contributor

mstange commented Oct 25, 2016

In a "top functions" view, all functions are displayed in a flat list (no tree structure), sorted by "inclusive time", i.e. sorted by the number of samples where this function is present anywhere on the stack.

Example:

Normal:

total self
19    -     (root)
19    -       RunLoop
10    -         ProcessCircles
10    2           ProcessElement
 8    8             Circle::Circumference()
 9    -         ProcessSquares
 9    3           ProcessElement
 6    6             Square::Circumference()

Inverted:

total self
8     8     Circle::Circumference()
8     -       ProcessElement
8     -         ProcessCircles
8     -           RunLoop
8     -             (root)
6     6     Square::Circumference()
6     -       ProcessElement
6     -         ProcessSquares
6     -           RunLoop
6     -             (root)
5     5     ProcessElement
5     -       ProcessSquares
5     -         RunLoop
5     -           (root)
5     -       ProcessCircles
5     -         RunLoop
5     -           (root)

Top functions:

total self
19    -     (root)
19    -     RunLoop
19    5     ProcessElement
10    -     ProcessCircles
 9    -     ProcessSquares
 8    8     Circle::Circumference()
 6    6     Square::Circumference()

In this example, ProcessElement is near the top of the list, and easy to find. In the current call tree you have to look for it under two different stacks.


I think we should have such a mode. We could make it a different mode inside the existing Call Tree tab, or we could have a new tab for it.


As a follow up, outside of the scope of this issue, it should would be nice to have the following abilities for each function:

  1. Restrict the profile to only show samples that contained this function in the stack
  2. Do the inverse of 1, i.e. remove all samples containing this function in the stack
  3. Look at the call tree of functions called by the selected function
  4. Look at the (inverted) call tree of functions that call the selected function

For example, we could split the tab three ways: the list on the left, and two tree views on the right, above each other, with the upper one showing 3 and the lower one showing 4.

┆Issue is synchronized with this Jira Task

@mstange mstange added the feature Work that is user facing, and typically should be planned through https://airtable.com/shrRydo6UXheb label Oct 26, 2016
@gregtatum gregtatum added the call tree Related to the call tree panel label Mar 8, 2017
@mikeconley
Copy link
Contributor

FWIW, Jan de Mooij built an external tool to help find the top functions:

https://jandem.github.io/profileviewer/

Would it be possible to use that as a starting point to get something like this added to perf.html?

@julienw julienw added the quantum flow Issues important to the Quantum Flow team label Jul 5, 2017
@julienw
Copy link
Contributor

julienw commented Apr 25, 2018

The hotspot tool has a nice view that is similar to what Markus suggested:
flattened top function view

@julienw
Copy link
Contributor

julienw commented Apr 25, 2018

Note that the view is sortable both by self time or children-included time.

@digitarald
Copy link
Contributor

@mikeconley is that the Heaviest Stack Trace sidebar from Instruments

image

If not, Instruments has also the Top Functions view options for the call tree. It also sounds similar to your description, as Top Functions is defined as

Enabling this makes Instruments consider the total time spent in a function as the sum of the time directly within that function, as well as the time spent in functions called by that function. So if function A calls B, then A’s time is reported as the time spent in A PLUS the time spent in B. This can be really useful, as it lets you pick the largest time figure each time you descend into the call stack, zeroing in on your most time-consuming methods.

@julienw
Copy link
Contributor

julienw commented Apr 26, 2019

See also this butterfly view experiment (where functions are ordered by self time instead of running time like it should)

@digitarald
Copy link
Contributor

This also came up in user feedback again as a list of hot spots that help to orient in a profile.

@julienw
Copy link
Contributor

julienw commented Feb 21, 2020

Here is the updated butterfly view experiment, this time using the running time.

@digitarald
Copy link
Contributor

I like it, but the UI does take its own tab and we'll have to train users on its own workflow.

I wonder if a v0 for this could be simpler. XCode solves it as checkbox in the call tree; which exposes it similarly to "Invert Call Tree" – which seems nice as it has a similar explorational use case.

image

@mstange @mikeconley would love your input on this Call Tree-based approach.

@mstange
Copy link
Contributor Author

mstange commented Feb 21, 2020

I don't have a strong opinion. But I think a tri-state selector in the Call Tree tab might work:

[Top-down | Bottom-up | Butterfly]

(actual names to be discussed)

@julienw
Copy link
Contributor

julienw commented Feb 21, 2020

Interestingly I thought of that too :-) The tab was a cheap way to get it out but I think we can do better.

@smaug----
Copy link

smaug---- commented May 18, 2020

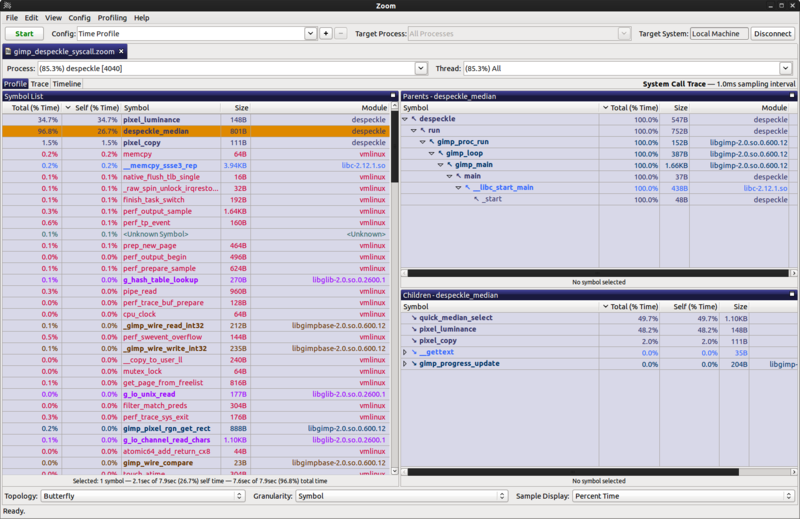
RotateRight's Zoom used to have rather great butterfly view
'Zoom'

@jandem
Copy link

jandem commented Feb 28, 2021

Could we start with the most simple version of this, just the top functions list, no butterfly view?

IMO this would make the profiler a lot more effective. I feel kind of lost when looking at complicated profiles without this view (I use it all the time with other profilers such as Instruments).

@gregtatum
Copy link
Member

I'm a bit confused by the top functions view. Is this any different than the inverted view in the call tree?

@mstange
Copy link
Contributor Author

mstange commented Mar 1, 2021

Here's an example: (edit: I've also added this to the issue description now)

Normal:

total self
19    -     (root)
19    -       RunLoop
10    -         ProcessCircles
10    2           ProcessElement
 8    8             Circle::Circumference()
 9    -         ProcessSquares
 9    3           ProcessElement
 6    6             Square::Circumference()

Inverted:

total self
8     8     Circle::Circumference()
8     -       ProcessElement
8     -         ProcessCircles
8     -           RunLoop
8     -             (root)
6     6     Square::Circumference()
6     -       ProcessElement
6     -         ProcessSquares
6     -           RunLoop
6     -             (root)
5     5     ProcessElement
5     -       ProcessSquares
5     -         RunLoop
5     -           (root)
5     -       ProcessCircles
5     -         RunLoop
5     -           (root)

Top functions:

total self
19    -     (root)
19    -     RunLoop
19    5     ProcessElement
10    -     ProcessCircles
 9    -     ProcessSquares
 8    8     Circle::Circumference()
 6    6     Square::Circumference()

The top functions view calls attention to ProcessElement, which is present in many samples. The inverted call tree view doesn't call attention to ProcessElement because it doesn't have much self time.

@julienw
Copy link
Contributor

julienw commented Mar 1, 2021

The inverted view orders by the self time, the functions view orders by the running time.

Thanks for the heads-up, I'll put that in our internal backlog

@julienw
Copy link
Contributor

julienw commented Mar 2, 2021

@jandem @mstange would cleaning up the work linked in #15 (comment) be good enough as a first step? (see #2388 for the list of left-over tasks).

image

I feel like it needs some more relationships with the other panels, but this can also be built on top of it later.

@mstange
Copy link
Contributor Author

mstange commented Mar 2, 2021

Yes, I think that would be a good first step. You could even drop the side panels for now and just have the top functions list. But we do need the performance to be addressed, see my comment in the PR.

@jandem
Copy link

jandem commented Mar 2, 2021

@jandem @mstange would cleaning up the work linked in #15 (comment) be good enough as a first step? (see #2388 for the list of left-over tasks).

That looks amazing. Thanks!

@mstange
Copy link
Contributor Author

mstange commented Dec 8, 2021

Here's a profile where a top functions view would work very well: https://share.firefox.dev/3rM8fEp
Some modules get loaded repeatedly from different stacks. For example, aria-query/lib/index.js shows up in different stacks: https://share.firefox.dev/3rLw530
A top functions view would show the modules in a flat list.

@gregtatum
Copy link
Member

Somewhat related, I was wanting to filter to just a single function the other day profiling mozilla::intl code, and I think a top functions would provide that if I could filter for functions on it.

@parttimenerd
Copy link
Contributor

I propose to add a simple version of this in #4205.

@mstange
Copy link
Contributor Author

mstange commented Nov 26, 2024

Implementation notes:

A naive implementation of this would walk the entire stack for each sample, and accumulate the sample's weight into a total-per-function array. However, it would also need to create a Set of functions for the current sample, to ensure that, if the same function is present in the stack multiple times, it only gets counted once.

Walking the entire stack for each sample is costly. Maintaining a set is costly too.

We should find something we can precompute based on the non-inverted call node table, so that if the sample information changes (e.g. because the user's preview range selection changes), it will be quick to recompute the total-per-function information.

I think a performant implementation of this could work as follows:

  1. (Base the work on top of Make inverting the call tree fast, by computing inverted call nodes lazily #4900, which reworks a lot of the call node + call tree code involved.)
  2. Build a table which is like the CallNodeTable but which, for each call node, doesn't have any duplicates of the same function in the "call path". Not sure what to call this table, let's just say DeduplicatedCallNodeTable for now.
  3. Also have a mapping from IndexIntoCallNodeTable to IndexIntoDeduplicatedCallNodeTable.
  4. Compute the FunctionListTimings as follows:
    1. Start with the "self cost per call node" i.e. callNodeSelf, which we already compute for the regular call tree.
    2. Propagate and accumulate the self cost upwards across the DeduplicatedCallNodeTable tree, like we do for the non-inverted call tree, to create a total per node in this tree.
    3. Iterate over all nodes in that tree, and, for every node, add the node's total to the per-function total of the node's function.

This gives you a per-function total that's relatively cheap to update as the selection changes.

The tricky part is how to create DeduplicatedCallNodeTable efficiently. When looking at a call node from the original call node table, we need to add this node to the deduplicated table only if the node's function isn't already present in the node's ancestors. We could create a JS Set for each node, but that seems very memory intensive. We could try to use a bloom filter.

@mstange
Copy link
Contributor Author

mstange commented Nov 28, 2024

I've prototyped the described approach in #5233.

Sign up for free to join this conversation on GitHub. Already have an account? Sign in to comment
Labels
call tree Related to the call tree panel feature Work that is user facing, and typically should be planned through https://airtable.com/shrRydo6UXheb quantum flow Issues important to the Quantum Flow team
Projects
None yet
Development

No branches or pull requests

8 participants