Audiobook reviews dashboard - Tableau excercise done in Python Dash
After making three dashboards in Python Dash, rather than Power BI, I thought I would give Tableau a go. Attempting the Audiobooks Tableau exercise in Udemy's The Business Intelligence Analyst Course, I was put off by the phrases
-
"For some reason, the date fields of the two tables we joined do not match up with each other correctly"
-
"Sometimes using a join, we’ll do a perfect job, while in other situations, blending will either deliver better or quicker results or be the only solution"
So again I thought, to hell with this, I want something I can trust. I first attempted this exercise in a Jupyter notebook, but found this to be too clunky and not very pretty, with all of the innards in plain view. So, once again, I turned to Python Dash which worked extremely well.
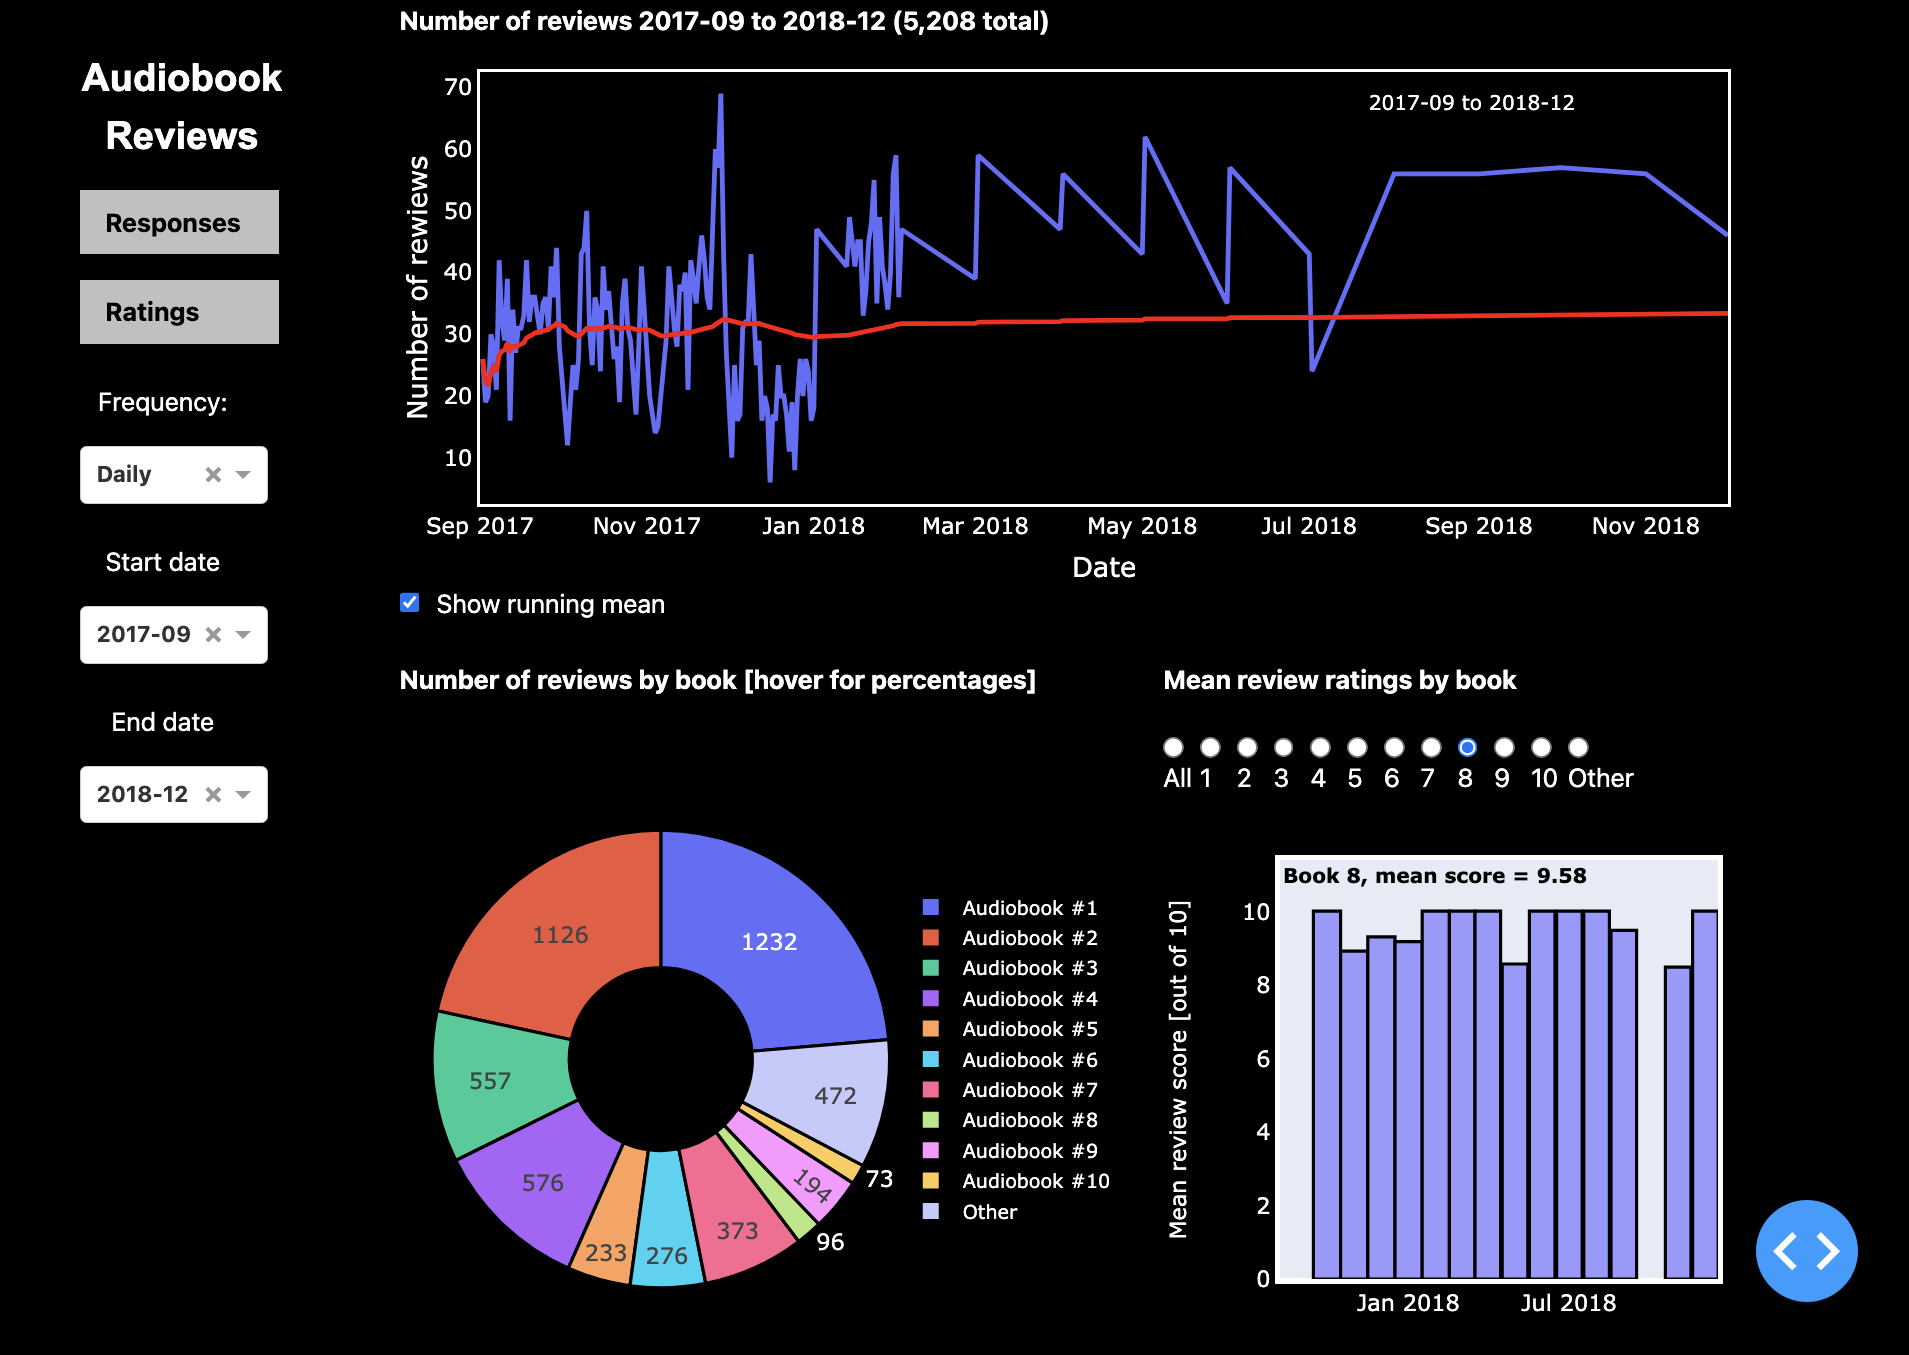
In addition to the required widgets, I've added a date filter so that the time evolution of the reviews can be monitered.
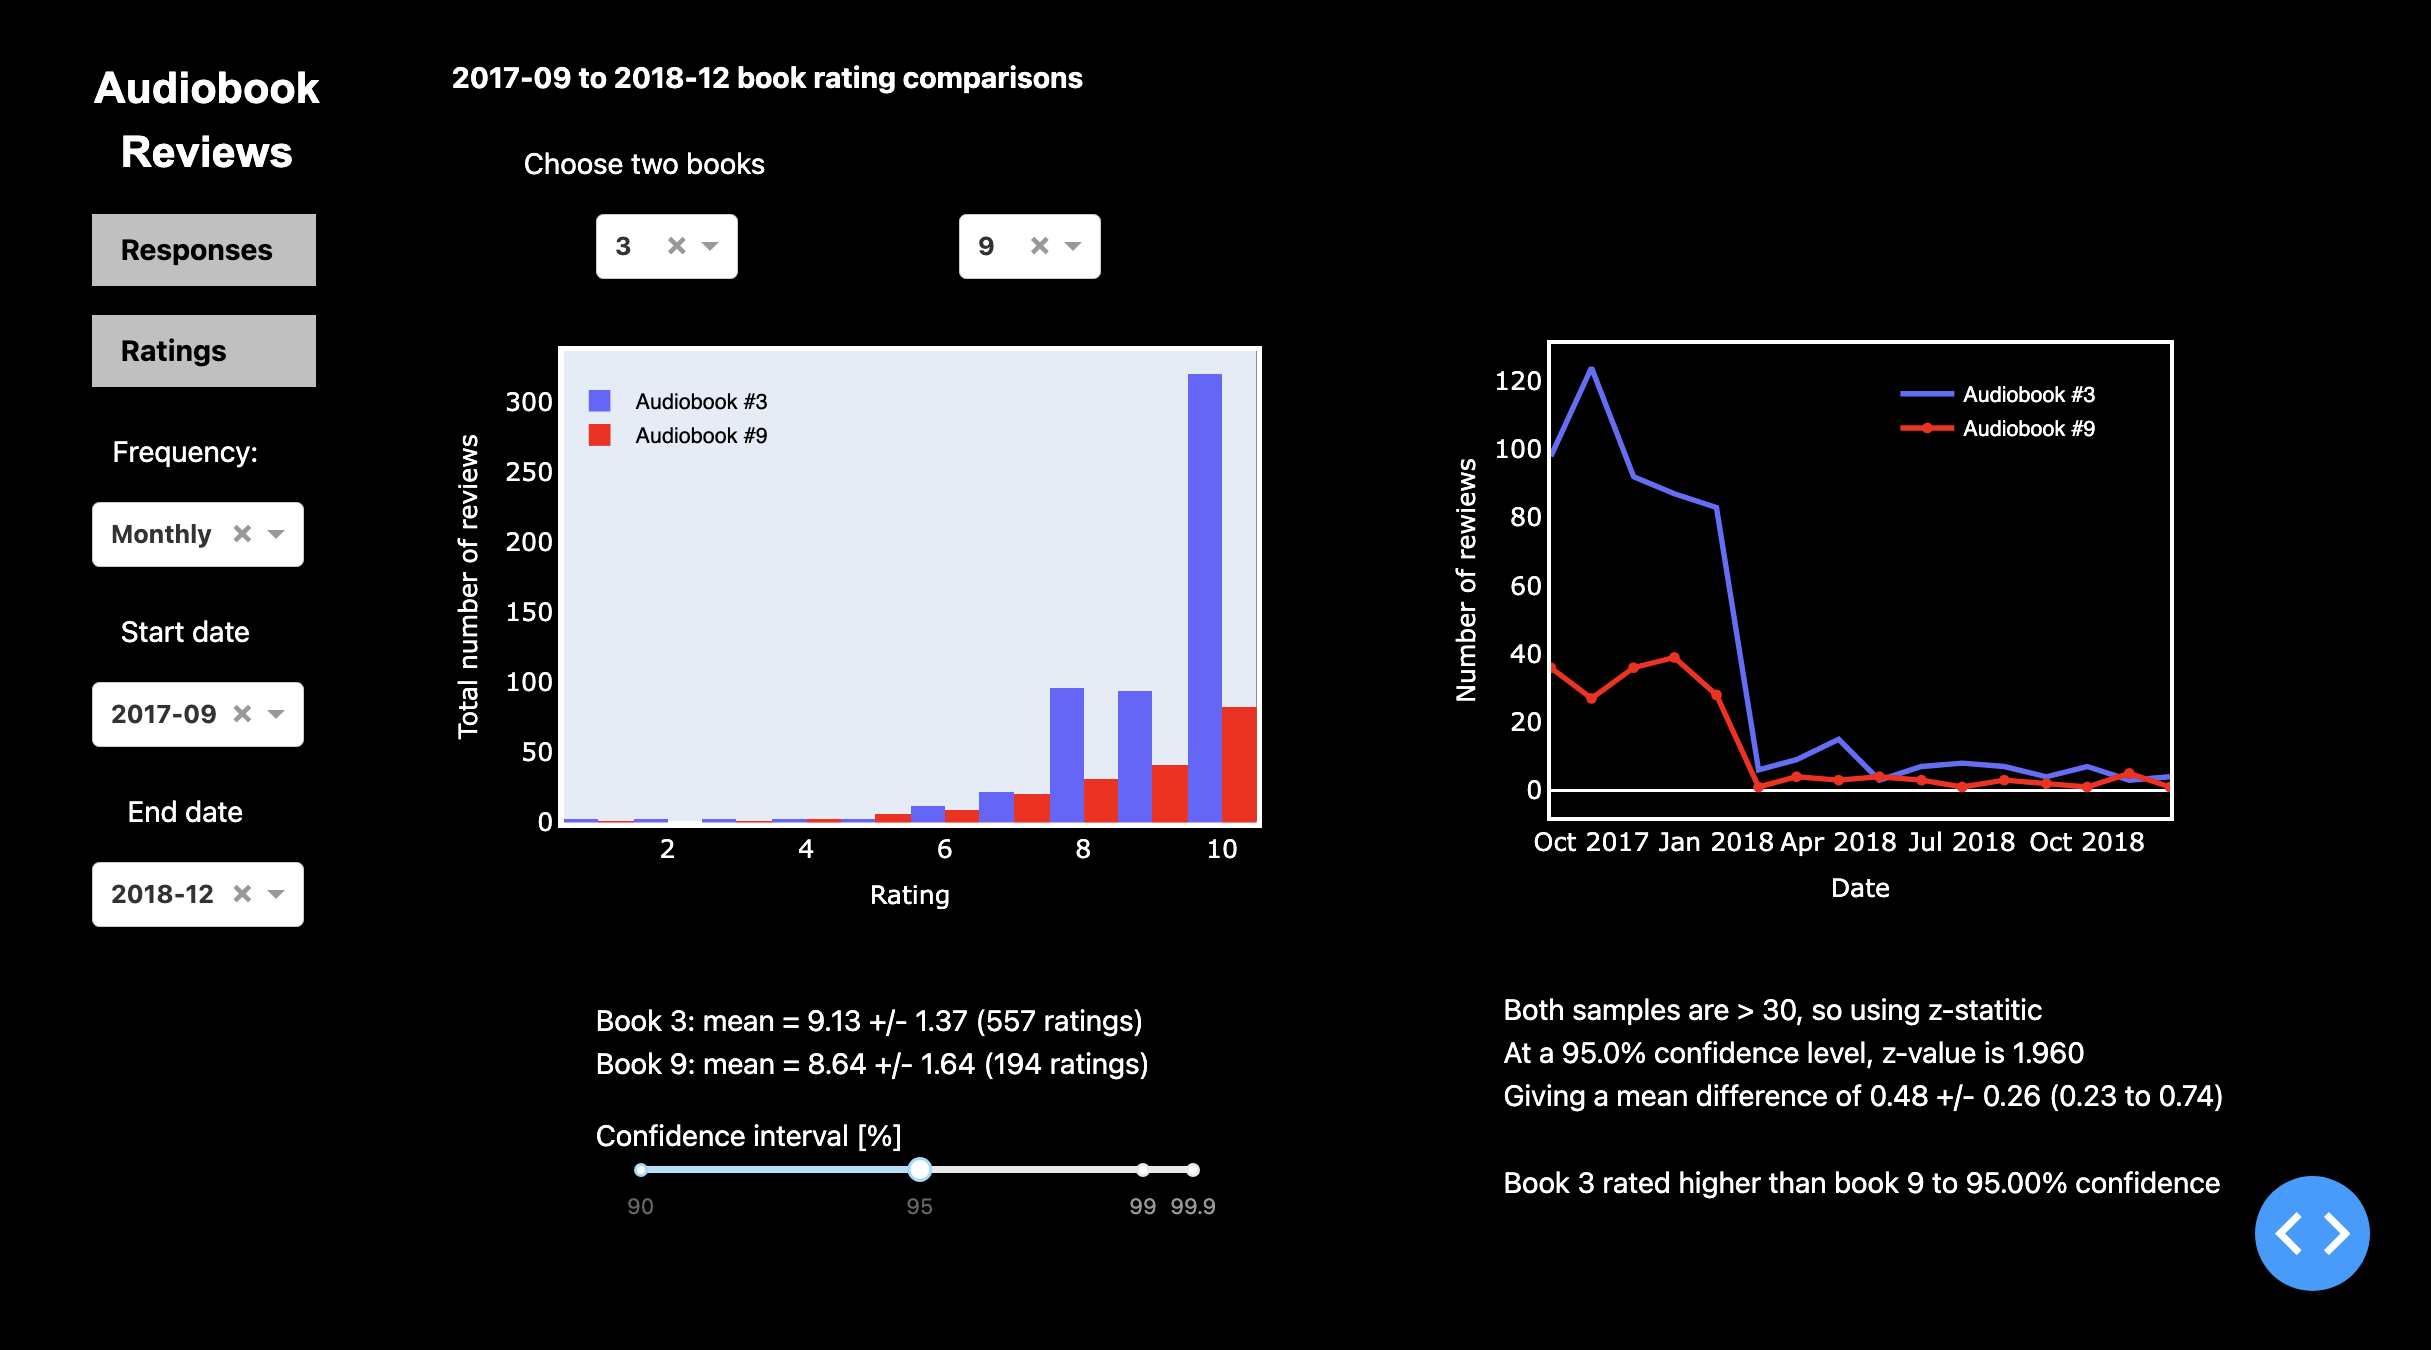
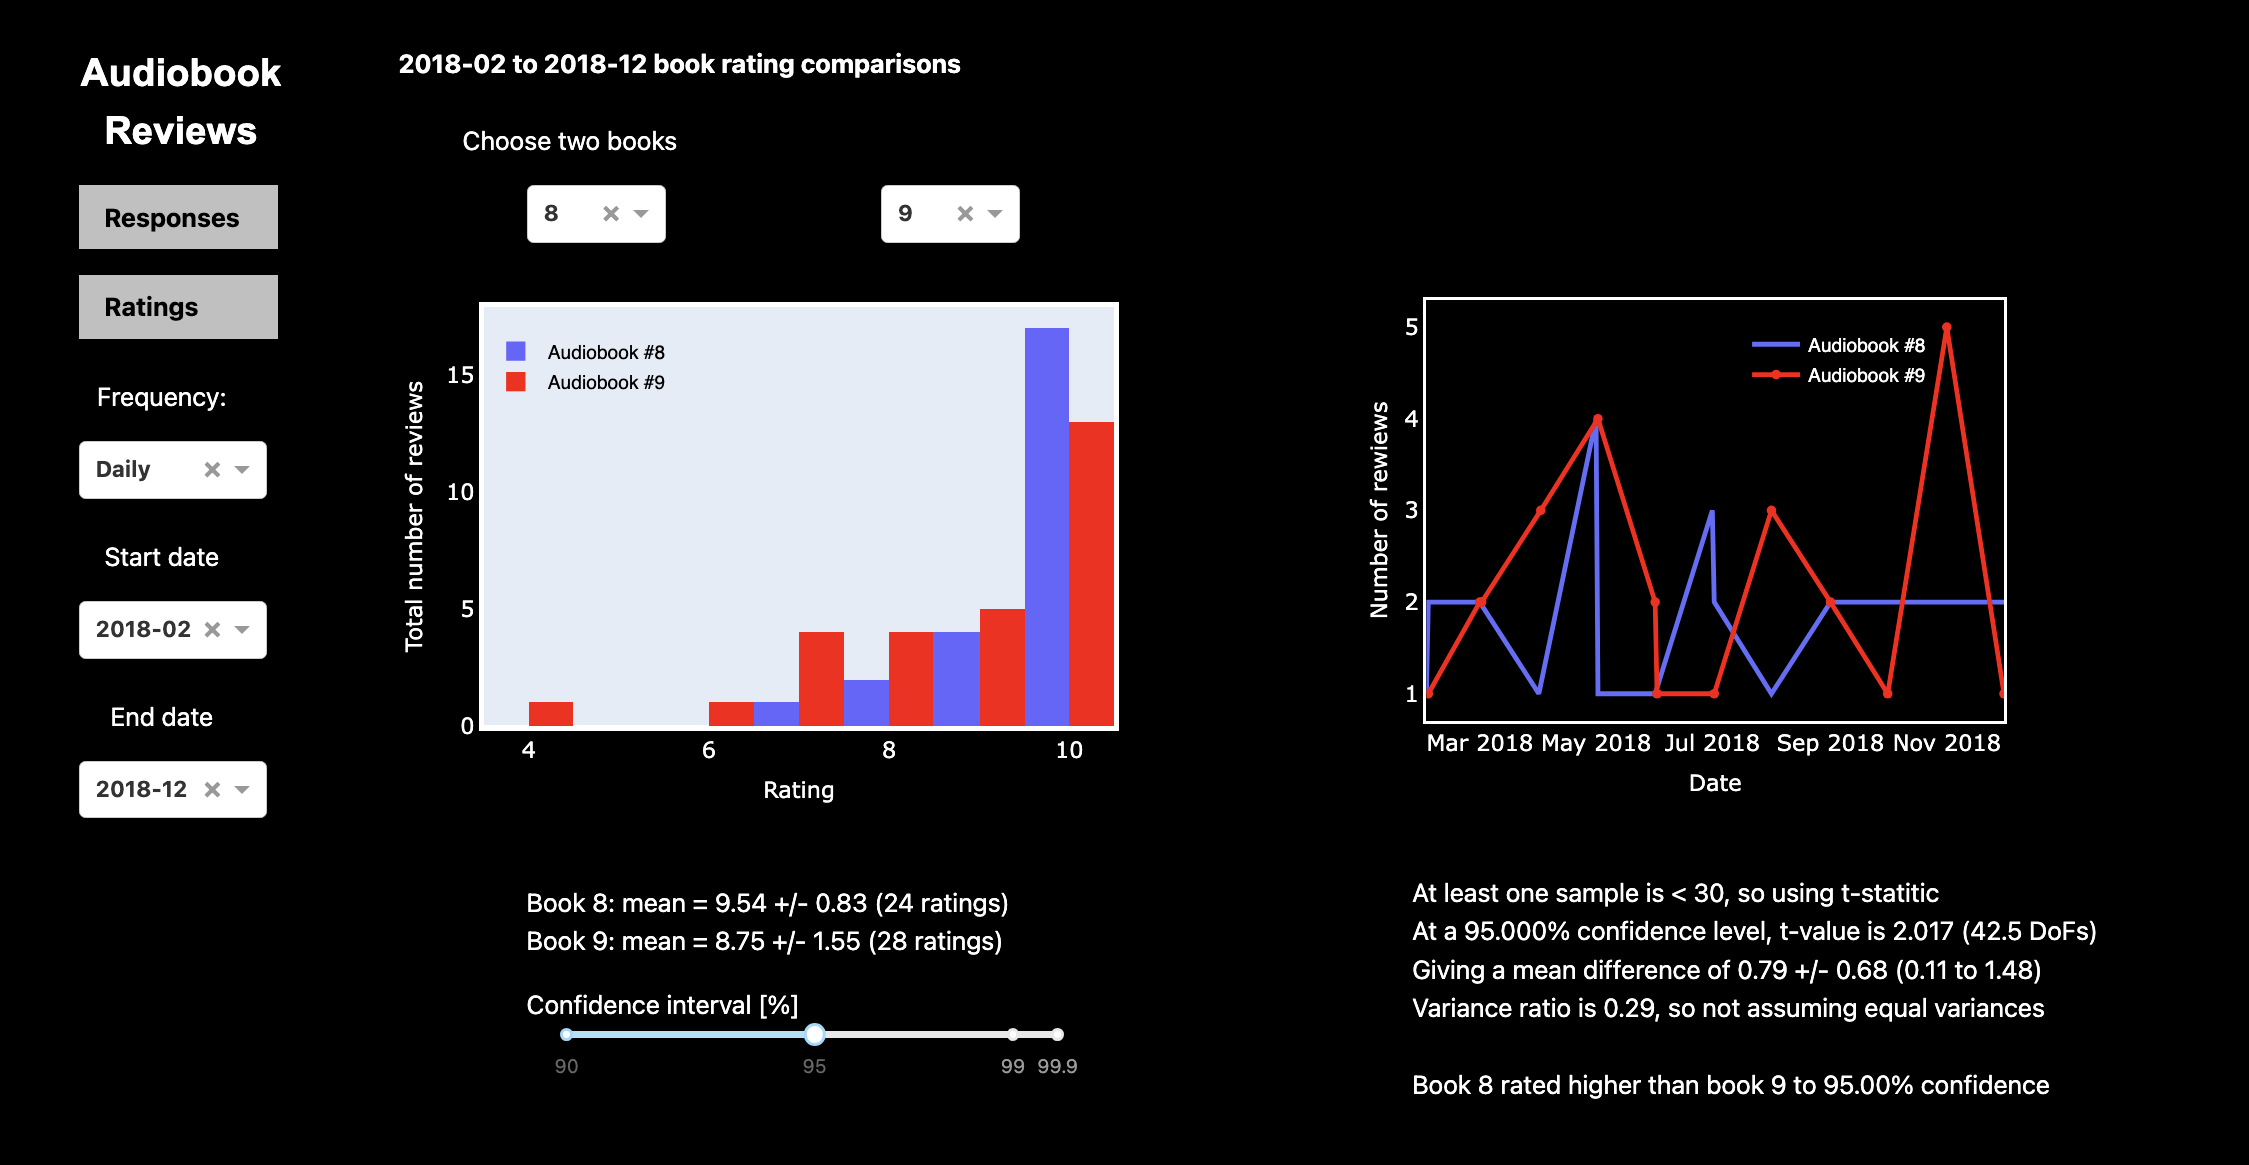
I have also added an extra page (Ratings), which allows the comparison of the ratings between books. Most of the books are rated very highly (obviously not reading the same ones as me), so to see this in action filter the dates to close to the end date, where the data are very sparse (the t-statistic will kick in when the numbers are small enough).
The dashboard can be accessted at http://steviecurran.pythonanywhere.com/