| 編輯者 | 學號 |
|---|---|
| 林昭廷 | Q36101341 |
| 簡煒軒 | Q36104234 |
- Background and Motivation
- Green Supply Chain Model
- Methodology
- Analysis Result
- Summary
- Reference
Green Supply Chain refers to the management between the facility operation, transportation and environmental effects of all facilities in a supply chain, i.e. the environment protection constraint is brought into facility location and allocation. Its purpose is to add environment protection consciousness into production and transportation, in order to improve the competitive edge of the supply chain regarding environmental effects.
The aim of most supply chain optimization problems is to minimize the total cost of the supply chain. However, since environmental protection is of concern to the public, a green supply chain,because of its minimum effect on nature, has been seriously considered as a solution to this concern.
We want to minimize the total cost of the supply chain and minimize the air pollution discharged from the supply chain to reduce the impact on the environment.
There are some important roles in a supply chian:
1.Manufacturers
2.Warehouses
3.Distribution centers
4.Customers
And these four roles will have the following five activities:
1.Manufacturer purchase raw materials
2.Assemble products in Manufacturers
3.Transport products from Manufacturers to Warehouses
4.Transport products from Warehouses to Distribution centers
5.Transport products from Distribution centers to customers
We assume 3 Manufacturers,4 Warehouses,5 Distribution centers,16 Customers,below figure is an assumption example which shows the structure of a supply chain:

| Set | Description |
|---|---|
| C | customers |
| D | distribution centers |
| W | warehouses |
| M | manufacturers |
| TM | transportation options for manufacturers |
| TW | transportation options for warehouses |
| TD | transportation options for distribution centers |
| I | suppliers producing raw material, type i |
| J | suppliers producing raw material, type j |
- Environmental impact function:
| PN | The amount of nitrogen oxide produced in supply chain (liter) |
|---|---|
| PC | The amount of carbon monoxide produced in supply chain (liter) |
| PO | The amount of volatile organic produced in supply chain (liter) |
- Cost function:
| RC | Total cost of purchasing raw materials from suppliers |
|---|---|
| FC | Fixed costs of opened facilities |
| VC | Variable costs of opened facilities |
| TC | Transportation costs |
| HC | Holding inventory costs in warehouses and distribution centers |
| BC | Backorder cost |
| Parameter | Description |
|---|---|
| demc | demand of customer c with mean μc and standard deviation σc |
| demf | demand of facility f ∈ {m,w, d} |
| crim | unit raw material cost from supplier of type i to manufacturer m |
| crjm | unit raw material cost from supplier of type j to manufacturer m |
| ctmmw | unit transportation cost from manufacturer m to warehouse w with transportation option tm |
| ctwwd | unit transportation cost from warehouse w to distribution centers d with transportation option tw |
| ctddc | unit transportation cost from distribution center d tocustomer c with transportation option td |
| disff′ | distance between facility f ∈ {m,w, d} and facility f ′ ∈ {w, d, c} |
| fcf | fixed cost of opening facility f ∈ {m,w, d} |
| ltm | lead time of facility f ∈ {m,w} |
| vcf | unit variable cost per unit for facility f ∈ {m,w, d} |
| invf | expected inventory at facility f ∈ {w, d} |
| nrri | number of units of raw material of type i required to produce one unit of the product |
| nrrj | number of units of raw material of type j required to produce one unit of the product |
| p | penalty cost per unit of customer demand if it is not fulfilled |
| caf | the capacity of facility f ∈ {m,w, d} |
| caf′ | capacity of transportation option f ′ ∈ {tm, tw, td} |
| GfN | rate of released nitrogen oxide to produce/handle one unit of product in facility f ∈ {m,w, d} |
| GfC | rate of released carbon monoxide to produce/handle one unit of product in facility f ∈ {m,w, d} |
| GfO | rate of released organic to produce/handle one unit of product in facility f ∈ {m,w, d} |
| Gf′N | rate of released nitrogen oxide per one unit of distance for transportation option f ′ ∈ {tm, tw, td} |
| Gf′C | rate of released carbon monoxide per one unit of distance for transportation option f ′ ∈ {tm, tw, td} |
| Gf′O | rate of released volatile organic per one unit of distance for transportation option f ′ ∈ {tm, tw, td} |
| Decision Variables | Description |
|---|---|
| xm | 1 if manufacturer m is opened / 0 otherwise |
| xw | 1 if warehouse w is opened / 0 otherwise |
| xd | 1 if distribution house d is opened / 0 otherwise |
| xtmmw | quantity of products shipped from manufacturer m to warehouse w by transportation option tm |
| xtwwd | quantity of products shipped from warehouse w to distribution center d by transportation option tw |
| xtddc | quantity of products shipped from distribution center d tocustomer c by transportation option td |
| xim | quantity of raw material transported to manufacturer m from supplier that produce raw material type i |
| xjm | quantity of raw material transported to manufacturer m from supplier that produce raw material type j |
- Objective function 1 --> Minimize cost:

- Objective function 2 --> Minimize pollution:

(12)–(14) determine the demand of each facility:

(15) and (16) also calculate the inventory level that each warehouse and distribution center must hold:

(17)–(18) also show that the standard deviation of demand for warehouses and distribution centers is defined as the weighted average of the standard deviation of demands assigned to them:

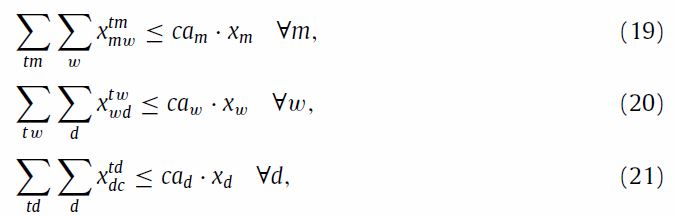
(19)–(21) ensure that we cannot assign a demand to a facility that is higher than its capacity:
(22)–(24) assure that if a facility does not supply any facility at its lower level, it will be closed and its binary variable is equal to zero:

(25) and (26) guarantee that the total raw material shipped from suppliers to a manufacturer can not be greater than the manufacturer demand, according to the required raw material for one product unit:

(27)–(28) ensure that the amount of product transported from a manufacturer and a warehouse must be equal to warehouse and distribution center demand respectively:

(29) distribution centers are allowed to not serve the percentage or total demand of a customer:

(30)–(32) are capacity constraints on transportation means, which prohibit assigning more than their capacity to the transportation means:

We minimize two objectives by setting one objectives to the constraint.


Although the majority of our equations are linear, this is a nonlinear problem , subtitute (17)(18) into (15)(16). We call a module from Python,called "Pyomo".
There is a solver Ipopt can caculate continuous nonlinear problems.

Both the number of manufacturer and distribution center increase,the cost and pollution are also increased in SCM.
However,the distribution center has many routes, when the number of distribution centers increases, the cost and pollution increase is larger than that of the manufacturer.

The following pictures show that transportation cost account for large proportion in SCM.
If the customer number grow ,more products could not deliverd to customer in time so that the backorder cost increase.

-
Multi-objective green supply chain optimization with a new hybrid memetic algorithm using the Taguchi method ,R. Jamshidi, S.M.T. Fatemi Ghomi,B. Karimi
-
Operations-Research-Applications github, Dr. Chia-Yen Lee
-
Handout of Operations Research Applications, ORA_08_MODA_2021_ncku, Dr. Chia-Yen Lee